| Sailings | Chart Work Exercises | Information from Charts | Tides | Sextant |
Terrestrial Navigation
Tides
Tides
Tides are the periodic motion of the waters of the sea
due to changes in the attractive forces of the moon and sun upon the rotating
earth.
Tides can either help or hinder a mariner. A high tide
may provide enough depth to clear a bar, while a low tide may prevent entering
or leaving a harbor.
Tidal current may help progress or hinder it, may set
the ship toward dangers or away from them.
By understanding tides, and by making intelligent use
of predictions published in tide and tidal current tables and of descriptions
in sailing directions, the navigator can plan an expeditious and safe passage.
Tide And Current
The rise and fall of tide is accompanied by horizontal
movement of the water called tidal current. It is necessary to distinguish
clearly between tide and tidal current, for the relation between them is
complex and variable.
For the sake of clarity mariners have adopted the
following definitions: Tide is the vertical
rise and fall of the water, and tidal current is
the horizontal flow. The tide rises
and falls, the tidal current floods and ebbs. The navigator is concerned with
the amount and time of the tide, as it affects access to shallow ports. The
navigator is concerned with the time, speed, and direction of the tidal
current, as it will affect his ship’s position, speed, and course.
Causes Of Tides
The principal tidal forces are generated by the moon
and sun. The moon is the main tide-generating body. Due to its greater
distance, the sun’s effect is only 46 percent of the moon’s.
Observed tides will differ considerably from the tides predicted by equilibrium
theory since size, depth, and configuration of the basin or waterway, friction,
land masses, inertia of water masses, Coriolis
acceleration, and other factors are neglected in this theory. Nevertheless,
equilibrium theory is sufficient to describe the magnitude and distribution of
the main tide-generating forces across the surface of the earth.
General Features
At most places the tidal change occurs twice daily.
The tide rises until it reaches a maximum height, called high tide or high
water, and then falls to a minimum level called low tide or low water.
The rate of
rise and fall is not uniform. From low water, the tide begins to rise slowly at
first, but at an increasing rate until it is about halfway to high water. The
rate of rise then decreases until high water is reached, and the rise ceases.
The falling tide behaves in a similar manner. The
period at high or low water during which there is no apparent change of level
is called slack water. The difference in height between consecutive high and
low waters is the range.
All the oceans are made up of several separate
oscillating basins. As such basins are acted upon by the tide-producing forces,
some respond more readily to daily or diurnal forces, others to semidiurnal
forces, and others almost equally to both.
Hence, tides are classified as one of three types,
semidiurnal, diurnal, or mixed, according to the characteristics of the tidal
pattern.
In the semidiurnal tide, there are two high and two
low waters each tidal day, with relatively small differences in the respective
highs and lows. Tides on the Atlantic coast of the
In the diurnal tide, only a single high and single low
water occur each tidal day. Tides of the diurnal type occur along the northern
shore of the
In the mixed tide, the diurnal and semidiurnal
oscillations are both important factors and the tide is characterized by a
large inequality in the high water heights, low water heights, or in both.
There are usually two high and two low waters each day, but occasionally the
tide may become diurnal.
Such tides are prevalent along the Pacific coast of
the
Special Tidal Effects
As a wave enters shallow water, its speed is
decreased. Since the trough is shallower than the crest, it is retarded more,
resulting in a steepening of the wave front. In a few estuaries, the advance of
the low water trough is so much retarded that the crest of the rising tide
overtakes the low, and advances upstream as a breaking wave called a bore.
Bores that are large and dangerous at times of large
tidal ranges may be mere ripples at those times of the month when the range is
small. Examples occur in
Other special features are the double low water (as at
The practical effect is to create a longer period of
slack water at high or low tide.
Tides and Tidal Streams
The sun and moon exert gravitational forces on all
parts of the earth. One of the results
of these attractive forces is the production of Tide Generating Forces.
As the differential
attractive force due to the moon is approximately twice that of the sun it
should be apparent that tides are more influenced by the moon. For this reason the interval between two
successive high waters is approximately half a Lunar Day (12hours and 25 m).
Spring
Tides
The configuration, when the sun and moon are in line
occurs at New Moon when the two bodies are in Conjunction. A High Water (HW) is produced at that point
on the earth’s surface, which is nearest to the sun and moon and also at the
opposite point. Two
Low Waters (LW) lie approximately mid-way between the two high waters.
When the sun and moon are in line, but on opposite
sides of the earth, they are said to be in Opposition. This occurs at Full Moon and produces a
similar situation to that which occurs at New Moon when the sun and moon are in
Conjunction.
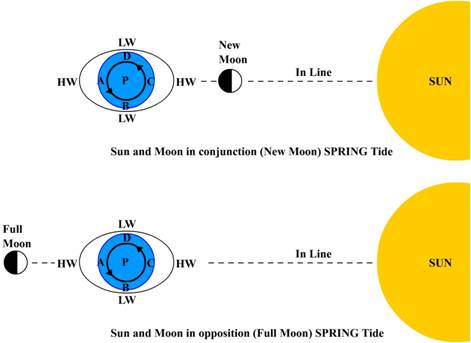
When the sun and moon are in line either at New Moon
or Full Moon, the maximum tide raising forces occur. These maximum forces produce the Highest High
Waters and the Lowest Low Waters, which are referred to as Spring Tides.
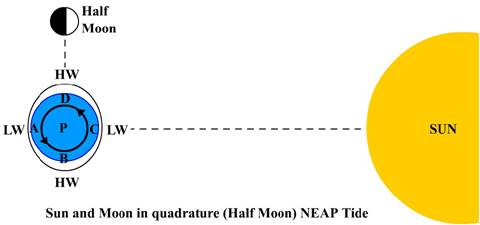
Neap Tides
When the sun and moon are at right angles to each
other they are said to be in Quadrature.
In this configuration the smaller attractive forces of the sun oppose
the larger attractive forces of the Moon.
This results in Lower High Waters and Higher Low Waters, which are referred
to as Neap Tides.
The
Duration of Tide is the time interval (time
difference) between a HW time and the preceding or following LW time at a
particular place.
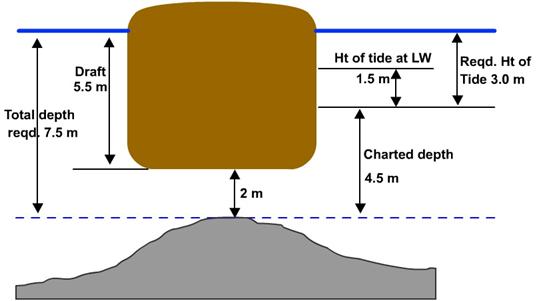
DEPTH AND
SOUNDINGS
It is frequently necessary to know the precise depth
of water beneath the keel or over some charted danger.
Depth of water can be measured by hand using the Hand Lead Line, or by use of the Patent Sounding Machine, or by some type of Echo Sounding Device.
In the case of the hand lead line the depth so
measured is from the surface water level whereas with an echo sounding device
depth is measured from a transducer situated in the bottom of the vessel.
In both cases it is necessary to apply a correction to
the measured depth in order that comparison can be made with the depth shown on
the chart.
Charted
depth
The depth shown on a chart is measured from a level
known as Chart Datum (CD). On a modern
chart, Chart Datum is normally placed at the level of the Lowest Astronomical
Tide (LAT), which is the lowest level which can be predicted to occur under
average meteorological conditions and under any combination of astronomical
conditions. It follows that the depth
shown on a modern chart is the least depth, which can be expected under normal
conditions.
Datum
A tidal datum is a level from which tides are
measured.
There are a number of such levels of reference that
are important to the mariner.
The most important level of reference to the mariner
is the sounding datum shown on charts. Since the tide rises and falls continually
while soundings are being taken during a hydrographic survey, the tide is
recorded during the survey so that soundings taken at all stages of the tide
can be reduced to a common sounding datum. Soundings on charts show depths
below a selected low water datum (occasionally mean sea level), and tide
predictions in tide tables show heights above and below the same level. The
depth of water available at any time is obtained by adding algebraically the
height of the tide at the time in question to the charted depth.
By international agreement, the level used as chart
datum should be low enough so that low waters do not fall very far below it. At
most places, the level used is one determined from a mean of a number of low
waters (usually over a 19 year period); therefore, some low waters can be
expected to fall below it. The following are some of the datum in general use.
Mean low water (MLW) is the average height of all low
waters at a given place. About half of the low waters fall below it, and half
above.
Mean low water springs (MLWS), usually shortened to
low water springs, is the average level of the low waters that occur at the
times of spring tides.
Mean lower low water (MLLW) is the average height of
the lower low waters of each tidal day.
Tropic lower low water (TcLLW)
is the average height of the lower low waters (or of the single daily low
waters if the tide becomes diurnal) that occur when the moon is near maximum
declination and the diurnal effect is most pronounced. This datum is not in
common use as a tidal reference.
Indian spring low water (ISLW), sometimes called
Indian tide plane or harmonic tide plane, is a low water datum that includes
the spring effect of the semi-diurnal portion of the tide and the tropic effect
of the diurnal portion.
It is about the level of lower low water of mixed
tides at the time that the moon’s maximum declination coincides with the time
of new or full moon.
Mean lower low water springs (MLLWS) is the average
level of the lower of the two low waters on the days of spring tides.
Some still lower datum used on
charts are determined from tide observations and some are determined
arbitrarily and later referred to the tide. Most of them fall close to one or
the other of the following two datum.
Lowest normal low water is a datum that approximates
the average height of monthly lowest low waters, discarding any tides disturbed
by storms. Lowest low water is an extremely low datum. It conforms generally to
the lowest tide observed, or even somewhat lower.
Once a tidal datum is established, it is sometimes
retained for an indefinite period, even though it might differ slightly from
later observations.
In some areas where there is little or no tide, such
as the
Heights of terrestrial features are usually referred
on nautical charts to a high water datum. This gives the mariner a margin of
error when passing under bridges, overhead cables, and other obstructions. The
one used on charts of the
Because there are periodic and apparent secular trends
in sea level, a specific 19 year cycle (the National Tidal Datum Epoch) is
issued for all
Epoch is periodically reviewed for revision.
LW and HW
Heights
LW and HW heights are always measured from Chart
Datum. Unless preceded by a minus sign,
LW heights are always additive to the charted depth. LW heights preceded by a minus sign indicate
that LW falls below datum and that the charted depth is reduced at LW.
Example
(a) Charted Depth 10.0 m (b)
Charted Depth 10.0 m
LW
from ATT 1.0 m LW from ATT -1.0
m
Predicted
Depth at LW 11.0 m 9.0
m
Rise of Tide
Rise of Tide is the vertical distance measured from LW
to the actual water level.
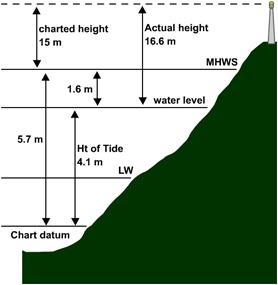
Height of
Tide
Height of Tide is the vertical distance measured from
Chart Datum to the actual water level.
Height of
Tide = LW Height + Rise of Tide.
Charted
Heights
The charted height of lighthouses, hills and other
high objects is given above the level of Mean HW Springs (MHWS).
In the case of a lighthouse the charted height is
measured from MHWS to the centre of the focal plane of the light.
Example
A lighthouse near
Charted
Height of Lighthouse (above MHWS) 19
m
MHWS
(from ATT Table V) Level above CD 4.7
m
LW
(from ATT) 1.7
Rise
of Tide 2.0
Height
of Tide (-)
3.7
Water
Level BELOW MHWS 1
Actual Height of Lighthouse above water level 20 metres
TIDAL
LEVELS
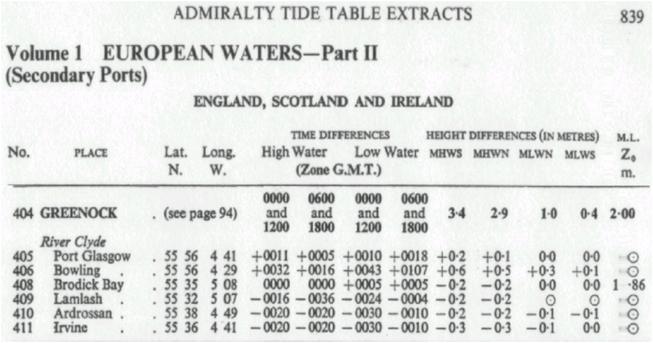
Tidal levels for Standard Ports are listed in Table V
of the Admiralty Tide Tables.
There are two types of ports,
The Admiralty Tide Tables include the Tidal Curve and
full details of day predictions for Standard Ports. They also list the Time and Height
Differences of Secondary Ports from the chosen
ADMIRALTW TIDE TABLES
Admiralty Tide Table (ATT) are
published in three volumes:
Vol. 1. European
Waters (including
Vol. 2.
Vol. 3.
Each of these volumes is divided into two parts:
Part 1. Standard Ports.
Part II. Secondary Ports.
Standard Ports are listed in the Index to Standard
Ports printed on the inside Front Cover of each volume.
Secondary Ports are listed in the Geographical Index
at the rear of each volume and which also includes the Standard Ports.
Each port is assigned an Index Number.
TYPES OF
TIDAL PROBLEM
Tidal problems fall into 4 main types in which it is
necessary to find:
1. Time
of HW and LW on a particular day.
2. Height
of Tide at an Intermediate Time between HW and LW.
OR
Reduction to Soundings (Correction to Leadline) at an
Intermediate Time
3. Time
at which m Required Height of Tide (or Depth of Water) is reached.
4. Correction
to Apply to the Charted Height of a Lighthouse or other shore object.
Tide
Calculations
Accuracy
and Interpolation
It must be borne in mind that meteorological
conditions which differ from average may cause differences between the
predicted and actual tide. Despite these
limitations, calculations should be worked as accurately as possible within the
limits of the tables and, particularly in examinations, all interpolation
shown.
Time Zones,
Zone Time, Standard Time and Time Differences
The Time Zone for the port in question is clearly
shown in the top, left hand comer of prediction pages in Admiralty Tide Tables. Daily
predictions are given in the normal Standard Time of the port. Before attempting calculations, time zones,
zonetime and standard time should be understood.
The world is divided into 24 Time Zones. Each Time
Zone is 15’ of longitude in width. The
‘Zero Time Zone’ extends from 7.5˚W to 7.5˚E this zone keeps
GMT. In each of the remaining 23 zones
the time differs from GMT by a whole number of hours and is numbered, in
sequence, 1-12: East of Greenwich with a Negative (-) prefix, West of Greenwich
with a positive (+) prefix.
e.g. 60˚E
lies in the 52.5˚E-67.5˚E Zone (Zone -4)
10˚W lies in the 7.5˚W-22.5˚W Zone
(Zone +1)
To obtain the Zone
Time for a position or place, subtract the Zone number algebraically from GMT.
Example-Given GMT 1200, what is the correct Zone Time
to keep in Longitude 60˚E (Zone - 4)?
GMT -(Zone) = Zone Time
1200 - (- 4) = 1600 i.e. 4 hours
ahead of GMT
or,
Zone Time+
(Zone) = GMT
1600 + (-4) = 1200
For convenience on land, a Standard Time is adopted throughout a given country. In most cases Standard Time or Legal Time is
that of the Zone in which the country mainly lies. Countries like
To prolong daylight hours, many countries also adopt
(for part of the year) a form of Daylight Saving Time or Summer Time. For such
periods, the time of the Eastward zone is usually adopted, e.g. BST (British
Summer Time), which is kept in the UK from a date in March to a date in
October, is the time for Zone - 1, i.e. GMT, -(-)1 = GMT + 1 hour., Time Differences for Secondary Ports,
when applied to the printed times of HW and LW at Standard Ports will give the
times of HW and LW at the Secondary Port in the Zone Time tabulated in the
tables for the Secondary Port.
Finding the
Times of HW and LW
Examples:
Find the
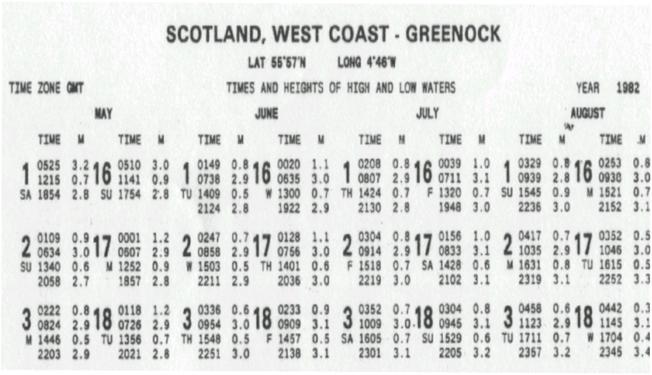
Standard Times of HW and LW at SHEERNESS on January 7th.
1. Turn
to “Index of Standard Ports” in ATT Volume I.
Find that Sheerness is a
2. Turn
to the - daily predictions for Sheerness.
 Four times are given with the height of the tide at
each instant. The High Waters are the higher figures, 5.3 m and 5.5 m. The Low
Waters are the lower figures, 1.2 m and 0.9 m.
Four times are given with the height of the tide at
each instant. The High Waters are the higher figures, 5.3 m and 5.5 m. The Low
Waters are the lower figures, 1.2 m and 0.9 m.
LW HW
Times: 0325 0952
1609 2237
Note that the times are Standard Times for the Time
Zone indicated. In this case the Time
Zone is GMT
Find the
BST (British Summer Time) of HW and LW at
1. Check
that
2. Turn
to the daily predictions for
3. Note
and apply the time difference: GMT + 1 hr = BST.
4 Subtract
the AM LW times and heights from the following HW times and heights to obtain
the Duration and
High Waters are 3.1 m and 3.4 m and Low Waters are 0.3
m and 0.4 m.
LW HW LW HW
GMT 0442 1145 1704 2345 (Aug 18th)
![]()
Time Diff. +01
+01 +01 +01
BST 0542
(18th) 1245 1804 0045 (19th)
HW 12 45 3.1m
LW 05 42 0.3 m
![]()
Duration 7h
03m 2.8 m Range
Note the time difference has made the BST of the
second High Water occur on the following day, which is August 19th.
Admiralty
Tidal Prediction Form - NP 204
NP 204. The form is included in the back pages of Admiralty Tide Tables
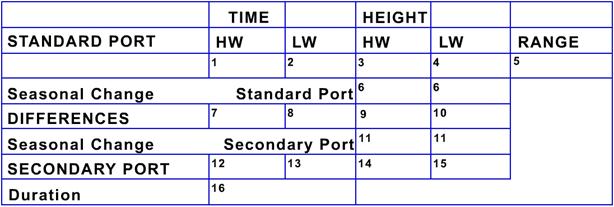
Note that the form contains boxes numbered 1-16.
To Find the Height of Tide at an Intermediate Time
between HW and LW (
Checklist 1
1. Check
that the port is in the ATT “Index to Standard Ports”. Turn to the appropriate page. Complete heading in NP 204. In boxes 1-4, write down the Times and
Heights of HW and LW which lie either side of the required time. Subtract LW height from HW height to obtain
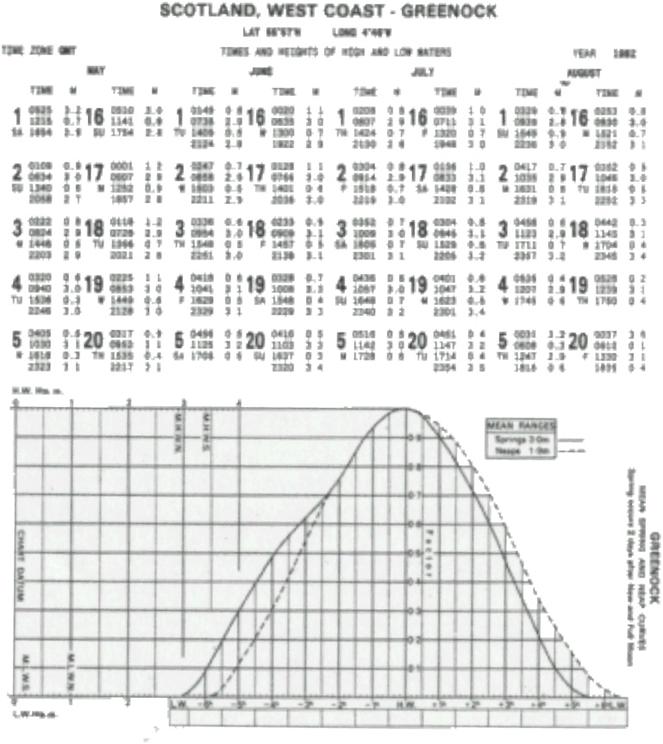
2. Turn
to the Tidal Diagram for the port (first page of predictions for that
port). Plot the heights of HW (top LH
scale) and LW (bottom LH scale), which occur either side of the required
time. Join by a sloping fine.
3. Write
down the HW time in the HW box below the curve.
In adjacent boxes, enter other times (differing by one hour intervals from
HW time) to “embrace” the required time.
It may be helpful to write down the required Time Interval from HW (i.e.
HW Time - Required Time).
4. Plot
the required time on the time scale (note, 10 minute divisions). Through this point draw a vertical line to
intersect the appropriate curve- see below instructions.
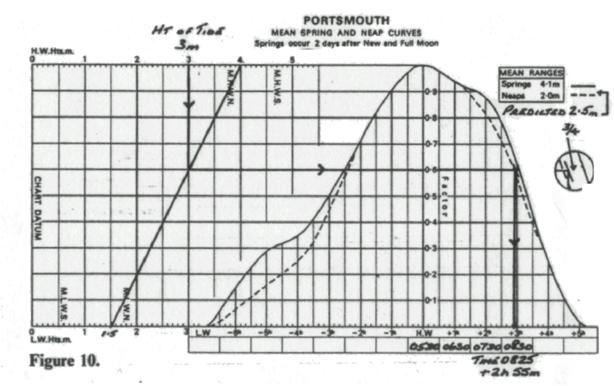
5. Note Spring and
Predicted
Range equal to or greater than
Predicted Range equal to or less than
Other
Ranges - Interpolate (and draw in the appropriate part of the curve as
explained below.)
6. From
vertical intersection with curve, proceed horizontally to sloping line (2) then
vertically to the Height Scale.
7. Read
off the Height of Tide (also known as Reduction to Soundings or Correction to
Leadline).
Interpolating
between Spring and Neap Curves
To interpolate between curves (i.e. where the
Express: {
Using this fraction, sketch in an intermediate curve,
parallel to the Spring curve this fractional distance
away from the Spring curve towards the Neap curve, e.g. Fraction ¼; draw curve
¼ of the distance away from the Spring curve towards the Neap curve.
Where there is an appreciable change in duration
between Spring and Neap tides, interpolating between
curves may result in a slight error. The error is greatest near LW.
Do not
extrapolate.
Example
(
Find the Height of Tide at
Use Checklist
1.
Height
Required 1300
|
|
TIME |
HEIGHT |
|
||
|
|
HW |
LW |
HW |
LW |
RANGE |
|
|
1012 |
1614 |
2.6 |
0.3 |
2.3 |
|
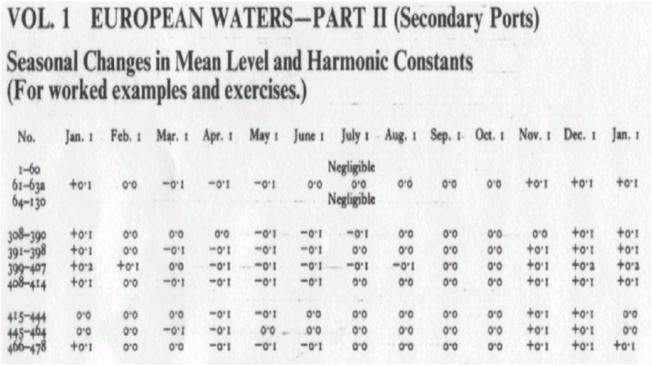
Seasonal Change |
|
|
|
|
|
|
DIFFERENCES |
|
|
|
|
|
|
Seasonal Change |
|
|
|
||
|
|
|
|
|
|
|
|
Duration |
|
|
|
|
|
Interpolation
(Step 5)
Predicted Range equals
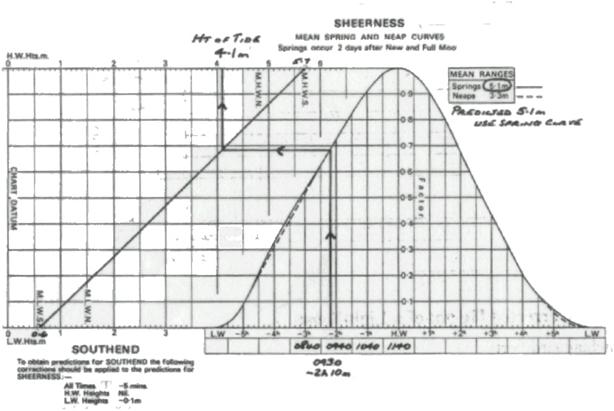
NB At this port the Spring and Neap curves coincide throughout the tidal cycle - so interpolation “between curves” is, in any case, not possible.
Plotting (Steps 2,
3, 4, 6 and 7)
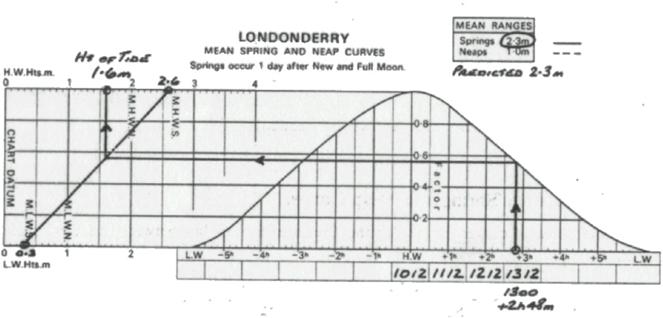
Answer 1-6 metres is the Ht of Tide above
Chart Datum.
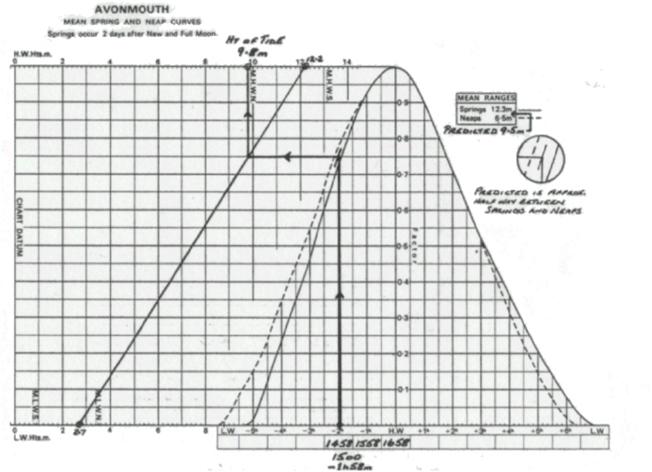
Example
(
Find the Height of Tide at Avonmouth at 1500 Standard
Time on November 28th.
Checklist 1. (Step 1)